Monday, June 25, 2012
GEO - Acting and Looking Bullish
The market (SPY) is down 1.56% today with 1.5 hours to go with convincing breadth, yet GEO is up .43%. That's bullish. The weekly chart is showing cup with handle pattern, which is also a bullish setup. However, beware of the tide which could easily trump individual current. Another caveat is that uptrend prior to the cup is non-existent. GEO should have good odds of advancing in a big way if the broad market turns up. Currently holding GEO long. Always do your own due diligence.
Friday, June 22, 2012
It's All About Volume, or Not
Throughout my trading career, it's no doubt that volume is the most basic yet the most elusive indicator. Aside from price itself, the only other thing that is always present in any chart is volume. Yet, I have the hardest time mastering the interpretation of volume in the context of price action.
We've all heard the trading adage, "volume proceeds price." But which volume bar really matters? Which volume bars still matter? What is considered heavy volume? Relative to what - previous bar, the average volume, or previous big volume bar? Does volume matter in an intraday chart? When does a big volume bar indicate exhaustion? Does volume analyses work on lower priced stocks?

As shown above (from: source), we want to see a trend continuation with increasing volume, thereby confirming the primary trend. But at some point, as suggested by another rule of thumb, "a surge in volume can often signify the end of a trend"? So when do we "flip" the volume interpretation? The following chart was the example used.

One indisputable concept regarding volume is when a break-out of is confirmed by heavy volume. There is no argument there. It's bullish, period.

But what if there is no volume confirmation on the break-out? Price can still rally for a long time with low volume. So what do we do? I posted the VZ chart the other day. There was a massive selling volume at the end of March that defined the epic level of resistance. But look what happened: it was taken out like a knife through a carrot cake -- without a fight, on only average volume. And it has rallied 10% since! The only take away is this: just because there is no volume confirmation, it doesn't mean you should fade the price.

Another common application of volume is on double bottoms (or tops). Assuming the first bottom is accompanied by heavy volume. After a rebound, if the second attempt to make a new low has diminished volume compared to the first, then we could expect a reversal soon. See the SPY daily chart below.

Everything else about volume is too nebulous, elusive, subjective or whatever word you want to use to describe it. It's an art. As such, I find volume as a trading tool quite unusable. Thank you very much. It often serves as a noise to confuse me in trading -- that is, until one day perhaps when I finally "get" it!! If you have any insights, please do post comments!
We've all heard the trading adage, "volume proceeds price." But which volume bar really matters? Which volume bars still matter? What is considered heavy volume? Relative to what - previous bar, the average volume, or previous big volume bar? Does volume matter in an intraday chart? When does a big volume bar indicate exhaustion? Does volume analyses work on lower priced stocks?

As shown above (from: source), we want to see a trend continuation with increasing volume, thereby confirming the primary trend. But at some point, as suggested by another rule of thumb, "a surge in volume can often signify the end of a trend"? So when do we "flip" the volume interpretation? The following chart was the example used.

One indisputable concept regarding volume is when a break-out of is confirmed by heavy volume. There is no argument there. It's bullish, period.
Another common application of volume is on double bottoms (or tops). Assuming the first bottom is accompanied by heavy volume. After a rebound, if the second attempt to make a new low has diminished volume compared to the first, then we could expect a reversal soon. See the SPY daily chart below.
Everything else about volume is too nebulous, elusive, subjective or whatever word you want to use to describe it. It's an art. As such, I find volume as a trading tool quite unusable. Thank you very much. It often serves as a noise to confuse me in trading -- that is, until one day perhaps when I finally "get" it!! If you have any insights, please do post comments!
Wednesday, June 20, 2012
VZ - Daily: Taking A Breather
Interesting chart. Reached the rectangle target and now consolidating. Still have no idea about the big volume blob near the end of march and how that 1st horizontal resistance was taken out with low volume and still be able to sustain almost 2 months now. No divergence either.

Tuesday, June 19, 2012
Technical Indicators Can Be "Noisy"
Usually we think of chatters on Yahoo, Twitters, blog sites, and CNBC as noises. But to me, excessive technical indicators are noises that are even more bothersome. As I enter a trade and set my stops, I'd realize the stop is just below a moving average -- if it's not on daily chart, I'd see one on the 60 minute chart. As a result, I tend to "stretch" my stop. Similarly, when a profitable trade has yet to reach my original target, I'd see that it's right at a Fibonacci level; as a result, I tend to get shaken out at that level prematurely. Without me knowing, these "noises" actually cause me to take profits too quickly, and hold on to losses too long. These also could get in the way of order entries. I wanted to go long on a breakout, but the "volume" is not confirming. Of course it turned out to be a summer day low volume rally and I'd miss the boat.
Here's a cursory list of the indicators I normally use, multiply them by the various time frames (weekly, daily, 60 minute, and 5 minute):

Here's a cursory list of the indicators I normally use, multiply them by the various time frames (weekly, daily, 60 minute, and 5 minute):
- Exponential moving averages (EMA): 10, 20, 50, 200
- Simple moving averages (SMA): 10, 20, 50, 200
- MACD
- STO
- RSI
- DMI
- Horizontal support/resistance
- Trend lines
- Channels
- Fibonacci retracements
- Fibonacci extensions
- TICKs
- Volume
What can one do with these type of noises? I don't know. It's an art. One can close one eye and pretend these TA indicators do not exist, or unlearn one's knowledge. But it's a matter of time that these indicators play a key role as inflection points. For example, one day you feel clueless why that market bounced; then you realize it bounced on the 50 day SMA while the whole time you watch only the 50 day SMA.
Again, one either gets bogged down with indecision if one includes too many technical indicators, or one can become blindsighted at times by ignoring too many of them. Take your pick!!!
Market has gone up substantially with the Greek election over the weekend 2 day ago. Now it's faced with FOMC meeting tomorrow. The_Real_Fly has claimed victory after recovering 18% within just last 2 weeks!! He's now 15% YTD and raised cash to 40%. Amazing. TraderFlorida continues to attack from the short side, but for day trades only. All signals are still flashing BUY, but SPY is at a major resistance level where my final add would have been 2 weeks ago when signals were still bearish. STO on both daily and 60 minute charts are overbought above 90. RSI is overbought on the 60 minutes, but ADX is high-trending at 33.31. I am bogged down with indecision!!! Cash is king, but surely I don't feel good missing the rallies from the long side in the past 2 weeks.
Friday, June 15, 2012
Perfect Finish But It's All Clear for the Bulls
Despite the epic Greece election pending this weekend, the market rallied hard. That by itself is remarkable. The market wants to go up. The Greek event may be just smoke and mirror, allowing the market insiders and institutions to steal shares from the fearful retailers and load up the boats. Look at the money flow today: tick up/down ratio of 2 to 1 with $12.5 million of money flow on block trades!

The dilemma is no more. What a difference a day makes (see yesterday's post on indecision). TraderFlorida exited his short positions. His bearish view has been a major headache for me as of late because he's been simply red hot (shorting AAPL, CMG, and LULU). I dare not to fade him. The_Real_Fly declared his victory today with FB up 6%, ZNGA up 10.5%, and YELP broke out, up 5.5%. Buydonthold.com's buy signal has been out a week ago since June 7. And the most conservative signal, BPCOMPQ finally flashes the buy signal at the end of the market TODAY!

The SPY had a perfect finish today right at the 50 day EMA and the projected upper trend line of the current down channel. This make it hard for the not-in-the-know retailers to enter long, but my suspicion is that Monday the market will breakout, giving all the price actions today and all the indicators available. It looks like it's all clear for the bulls. I relented as a bear, shying away from making any bearish bet. Not entering on the long side is the most I could muster up today as a bear.
Thursday, June 14, 2012
To Follow Or Not To Follow
Over the years I've followed a few services, blogs, and traders via Twitter. I can tell you eventually I stopped following them one by one, without exception. The reason I stop following has been that they caused my demise in one way or another. Then why follow?
Currently I've been following The_Real_Fly and TraderFlorida because they've been impressive. But as I've posted many times, The_Real_Fly has gone from 20% YTD return down to -5%, and now probably somewhere around 10%. Have my portfolio got hit in the process? You bet.
But the real issue is confusion and added stress. Think about it. If my trading signal says sell, but The_Real_Fly is 92% long, would I be less aggressive in shorting? Yes, I would, out of respect and fear. If then the market goes against me and rallies hard, how would I feel? Double whammy: on the one hand, I incur loss on my short positions; on the other, I feel I miss out on the "Fly" bandwagon while he does his best taunting his "enemies". It's an awful feeling.

Right now TraderFlorida is short and The_Real_Fly is long. My signal is about to turn from sell to buy. What should I do? So far TraderFlorida has a more consistent track record, but I've only followed him since 2 months ago. And he's only 10% short. The_Real_Fly has been suffering from giving it all back, but now could be the time he regains his losses. And he's over 90% long. Is this complicated or what?!
The best scenario is if my own signal agrees with the people I follow, but it only happens once in a while and I'd be subject to the aforementioned dilemma the rest of the time.
Tune out the noise -- yeah, only if you're confident with your own trading system. I am still learning and in search of the Holy Grail in the realm of trading, even though I know it does not exist.
Currently I've been following The_Real_Fly and TraderFlorida because they've been impressive. But as I've posted many times, The_Real_Fly has gone from 20% YTD return down to -5%, and now probably somewhere around 10%. Have my portfolio got hit in the process? You bet.
But the real issue is confusion and added stress. Think about it. If my trading signal says sell, but The_Real_Fly is 92% long, would I be less aggressive in shorting? Yes, I would, out of respect and fear. If then the market goes against me and rallies hard, how would I feel? Double whammy: on the one hand, I incur loss on my short positions; on the other, I feel I miss out on the "Fly" bandwagon while he does his best taunting his "enemies". It's an awful feeling.
Right now TraderFlorida is short and The_Real_Fly is long. My signal is about to turn from sell to buy. What should I do? So far TraderFlorida has a more consistent track record, but I've only followed him since 2 months ago. And he's only 10% short. The_Real_Fly has been suffering from giving it all back, but now could be the time he regains his losses. And he's over 90% long. Is this complicated or what?!
The best scenario is if my own signal agrees with the people I follow, but it only happens once in a while and I'd be subject to the aforementioned dilemma the rest of the time.
Tune out the noise -- yeah, only if you're confident with your own trading system. I am still learning and in search of the Holy Grail in the realm of trading, even though I know it does not exist.
Wednesday, June 13, 2012
AAPL - At Inflection Point
Very weak price action but the first inflection point for possible bounce is the lower trend line of the ascending channel.
Tuesday, June 12, 2012
YELP - Strong Overhead Resistance
After a 44% move over the last week or so, YELP has a strong resistance area to deal with at the circled area which is a confluence of resistance comprised of:

- The light blue horizontal trend line, representing the 1.8 million shares of overhead supply set on May 3 at 20.30.
- The dotted red line, representing the upper trend line of the descending channel extrapolated from the solid red lower channel line.
- The olive line, representing the 50 day EMA at 20.01.
Support is the cyan horizontal line at 17.80. Given the strong momentum, I suspect it would break out after a few sessions of consolidation.
Monday, June 11, 2012
Bulls Choked Big Time
I re-entered a small short position last Thursday via SPXU. The market had a big bounce off it 200 day EMA the next day on Friday. All signals except for BPCOMPQ were flashing buy by the end of day Friday. I was thinking here we go I was on the wrong side of the market again. Over the weekend, IMF agreed to bail out the Spanish banks via a €100 billion loan. Along with the rest of the bears, I was anxious over the weekend and had to make real attempt to distract myself from the the impending bloodshed on the bears. The futures were up as much as 1.5% last night (Sunday). This morning as I was ready to embrace the slaughter, I was pleasantly surprised that the gap up was only under .8% on SPY. In spite of the weaker than expected open, I was still prepared for the market to rally toward the SPY 135.75 major resistance in time -- the market was oversold and if the market had to rally, this news is IT!!! However, the market ended up selling throughout the day and never looked back.
So this is total emotional roller coaster. Instead of seeing big loss on my SPXU position, it's now actually green. Now I wished I had bought more on today's gap up. One simply can never be truly happy whether the market goes up or down. Greed and fear would ensure that you'll never be happy.
I can't imagine how The_Real_Fly has had to go through. Started with +20% YTD during the first quarter, he gave it all up and was down -3% YTD just two weeks ago. After last week's biggest rally of the year, including a 40% move on his biggest position, YELP, he was up 7% YTD. The weekend bailout news was supposed to bolster his momentum of win-ship, but as it turned out, the rally fizzled right out of the gate and turned into a sell-off day, losing in excess of 3%. Today was truly ironic. But at least the bulls were the one who got to sleep well and celebrate during the weekend, basking on the Spain bailout news.
Trading and investment is too tough in today's environment.
Friday, June 08, 2012
Short Term Rally Mode
Since my post earlier this week on market at major support, SPY has been up for 4%, The_Real_Fly has come back to the positive territory YTD, and buydonthold.com has issued a buy signal. Sentiment spread also favors the bulls with a reading of just 7.4%. The only thing that is still holding the sell signal is the $BPCOMPQ, but realize it's a more conservative signal and it is also in the process of turning bullish.
Despite the lighter volume, the market can bounce until it doesn't. So there is no need to fight it. During this short term trend change, and possibly whipsawing sideway movement, it's best to be lightly long or lightly short. In this way, you can accumulate swing positions on either direction with the option to take crumb profits as you see fit.

Notable change of character is YELP. I've noticed it these past two days that the volume has come in and prices have held even as the general market sold off yesterday. This should make Fly real happy. Pair trade shorting ZNGA and longing YELP would have worked well. The 20.50 area could be problematic, however, due to possible overhead supply.

Despite the lighter volume, the market can bounce until it doesn't. So there is no need to fight it. During this short term trend change, and possibly whipsawing sideway movement, it's best to be lightly long or lightly short. In this way, you can accumulate swing positions on either direction with the option to take crumb profits as you see fit.
Notable change of character is YELP. I've noticed it these past two days that the volume has come in and prices have held even as the general market sold off yesterday. This should make Fly real happy. Pair trade shorting ZNGA and longing YELP would have worked well. The 20.50 area could be problematic, however, due to possible overhead supply.
Tuesday, June 05, 2012
Market Right At Support On Multiple Time Frames
The SPY daily broke the 200 day SMA yesterday but bounced off off the lower trend line.

On the other hand, the SPY weekly lost the 50 week SMA yesterday but bounced off off the projected lower channel line.

Given we are in an oversold conditions but in a confirmed bear market, anything can happen. This week is crucial.
On the other hand, the SPY weekly lost the 50 week SMA yesterday but bounced off off the projected lower channel line.
Given we are in an oversold conditions but in a confirmed bear market, anything can happen. This week is crucial.
Monday, June 04, 2012
Current Standing
After last Friday's selling, I am all out of short positions via SPXU, TZA, and VXX. I am now mostly cash with a few spotty long losers viz ZNGA, FB, YELP, GSVC, ... You get the picture: the deflated social media stocks. Had I been more aggressive shorting, thanks to TraderFlorida and Mr. Fly going against my positions, I would have been able to take partial profit and still keep some short positions. But that's the way it is, for now. One has to be nuts to not take some profit at the trend line and 200 day SMA support last Friday. My position was simply too small for partial profits.

Going long would be a counter trend trade, and going short would be chasing. Best thing would be just wait and see, except for day trades.
Here are some arguments against chasing the shorts:
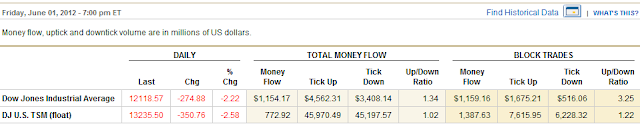
The RS for SPY are oversold at 27.32 and 29.31 in the 60 minute and daily charts, respectively. The ADX on the 60 minute is actually quite modest at 23.53, not entirely ruling out mean reversion trades. And the STO on the 60 minute chart is at a stunning 3.65 level! Last Friday's blood bath and break-down below the 200 day SMA actually resulted in a positive money flow:

Going long would be a counter trend trade, and going short would be chasing. Best thing would be just wait and see, except for day trades.
Here are some arguments against chasing the shorts:
The RS for SPY are oversold at 27.32 and 29.31 in the 60 minute and daily charts, respectively. The ADX on the 60 minute is actually quite modest at 23.53, not entirely ruling out mean reversion trades. And the STO on the 60 minute chart is at a stunning 3.65 level! Last Friday's blood bath and break-down below the 200 day SMA actually resulted in a positive money flow:

With the Greece bailout meeting not until end of June, and the QE3 hint in the same time frame, the market can also take a little breather from the downside any time.
That being said, the market is officially a bear market, and the $BPCOMPQ is diving straight down.

So the best scenario is to wait for a bounce and look for opportunity to go short. Unfortunately, too many people are hoping for a bounce right now. We know what market loves to do, don't we?
Friday, June 01, 2012
AAPL - Hanging By A Thread
Sitting on the bear flag channel and on the 20 day EMA. Looking treacherous. No positions.


AEM - Too Bad
AEM up over 8% today, on the verge to breakout of the cup with handle structure. I posted a long set up mid-May. It was a nice setup, but too bad it fell victim of a shake-out. See circled area. I wonder how many trader (not investors who simply rely on "hope") were able to withstand and not waver. Too bad for me, AEM snapped back with fury since and I could not bring myself to chase after it. Such is life.

Tune Out the Noises
Once in a blue moon, my plan worked out. The May bottom got retested on a big red gap. The late May rally was a bear flag after all. As my first target has been met, I've taken the profit off the table (SPXU, VXX, TZA). I'm not going to get greedy, especially with the weekend ahead where Europe may come up with a quick plan to kick the can down the road for a few more months. You may disagree, but that was my plan.

I would have been a bit more aggressive following my plan if it weren't for TraderFlorida getting bullish in the past few sessions. He even kept 1/2 of his AAPL position overnight, and actually he said he was going to add more yesterday if AAPL held on to the HOD. My bearishness was undoubtedly dampened by the red hot TraderFlorida's short term bullishness. Let's not kid ourselves, if TraderFlorida is long AAPL, who in his right mind would dare to short AAPL?! So I concocted a pair trade, shorting SPY and long AAPL, overnight. I made out break-even this morning but was more than a bit rattled because the pair trade assumed upside move where AAPL would outperform SPY. On a downside move, AAPL would move faster than SPY as well.

And how about Mr. Fly, the other twitter personality I respect and follow? He was up as much as 20% YTD but as of today he's (-3%). That's a 23% swing!!! See his blog today: A Story of Decay and Destruction. If this kind of roller coaster happens to a professional fund manager, what do you expect as a small time trader/investor? As he was down so much in the past few session and was still adding more chips to the fire, I couldn't help but adding a few of his longs in sympathy and also just as hedges to my short ETF's, out of respect (and fear of him). For example, ZNGA, YELP, and TEX. Well, needless to say, these hedges were just like insurance premiums, spent in vain as the "just in case" scenario did not pan out.


Tune out the noises - not just CNBC but other tweeters and bloggers as well -- IF you have a trading plan which you should, otherwise, you shouldn't be trading. Not tuning out the noises would confuse you and lessen the conviction for your own trading plan. Even if he is a respected trader and has a red hot track record, you never see his trading plan as a whole, how much confidence (and thus what position size), how much hedges he has behind the curtain, etc. Does it sound familiar when a stock tanked and you were pretty much sure that John Doe was screwed, only to find out later that he held some options to hedge his bet and revealed that he made out OK? Should you risk your hard earned money on only half of a story?
I would have been a bit more aggressive following my plan if it weren't for TraderFlorida getting bullish in the past few sessions. He even kept 1/2 of his AAPL position overnight, and actually he said he was going to add more yesterday if AAPL held on to the HOD. My bearishness was undoubtedly dampened by the red hot TraderFlorida's short term bullishness. Let's not kid ourselves, if TraderFlorida is long AAPL, who in his right mind would dare to short AAPL?! So I concocted a pair trade, shorting SPY and long AAPL, overnight. I made out break-even this morning but was more than a bit rattled because the pair trade assumed upside move where AAPL would outperform SPY. On a downside move, AAPL would move faster than SPY as well.
And how about Mr. Fly, the other twitter personality I respect and follow? He was up as much as 20% YTD but as of today he's (-3%). That's a 23% swing!!! See his blog today: A Story of Decay and Destruction. If this kind of roller coaster happens to a professional fund manager, what do you expect as a small time trader/investor? As he was down so much in the past few session and was still adding more chips to the fire, I couldn't help but adding a few of his longs in sympathy and also just as hedges to my short ETF's, out of respect (and fear of him). For example, ZNGA, YELP, and TEX. Well, needless to say, these hedges were just like insurance premiums, spent in vain as the "just in case" scenario did not pan out.


Tune out the noises - not just CNBC but other tweeters and bloggers as well -- IF you have a trading plan which you should, otherwise, you shouldn't be trading. Not tuning out the noises would confuse you and lessen the conviction for your own trading plan. Even if he is a respected trader and has a red hot track record, you never see his trading plan as a whole, how much confidence (and thus what position size), how much hedges he has behind the curtain, etc. Does it sound familiar when a stock tanked and you were pretty much sure that John Doe was screwed, only to find out later that he held some options to hedge his bet and revealed that he made out OK? Should you risk your hard earned money on only half of a story?
Subscribe to:
Posts (Atom)