Warning: Following my trades may be hazardous to your financial health. See Disclaimer.
Showing posts with label Trade Setups. Show all posts

Tuesday, July 10, 2012

Can't Get Excited About AAPL

Despite all systems are flashing buy signals, and TraderFlorida is once again long on AAPL, I just can't bring myself to pull a long position.  The AAPL daily chart is against the 76.4 Fib retracement and the ascending channel.


But that's not reason to be bearish at all.  What really troubles me is the 60 minute chart.  Prices retreated and then broke into new highs, and yet the MACD went flat-line, no response whatsoever despite high volume.  No, I am not shorting and being crazy enough to trade against TraderFlorida.  I'm watching and learning.


UPDATE:  Here is how AAPL ended the day.  So this time I was right.  See To Follow Or Not To Follow, this time I'd be better served to tune out even the "noise" from TraderFlorida.  But bottom line remains: what's the odds that I am right?  


Monday, June 25, 2012

GEO - Acting and Looking Bullish

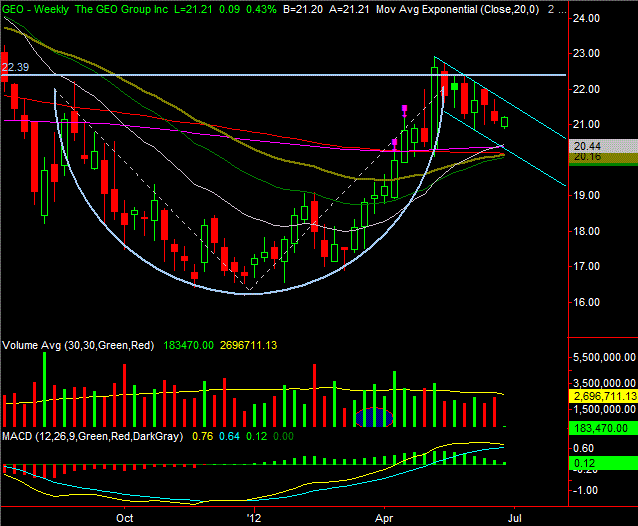
The market (SPY) is down 1.56% today with 1.5 hours to go with convincing breadth, yet GEO is up .43%.  That's bullish.  The weekly chart is showing cup with handle pattern, which is also a bullish setup.  However, beware of the tide which could easily trump individual current.  Another caveat is that uptrend prior to the cup is non-existent.  GEO should have good odds of advancing in a big way if the broad market turns up.  Currently holding GEO long.  Always do your own due diligence.


Wednesday, June 20, 2012

VZ - Daily: Taking A Breather

Interesting chart.  Reached the rectangle target and now consolidating.   Still have no idea about the big volume blob near the end of march and how that 1st horizontal resistance was taken out with low volume and still be able to sustain almost 2 months now.  No divergence either.


Wednesday, June 13, 2012

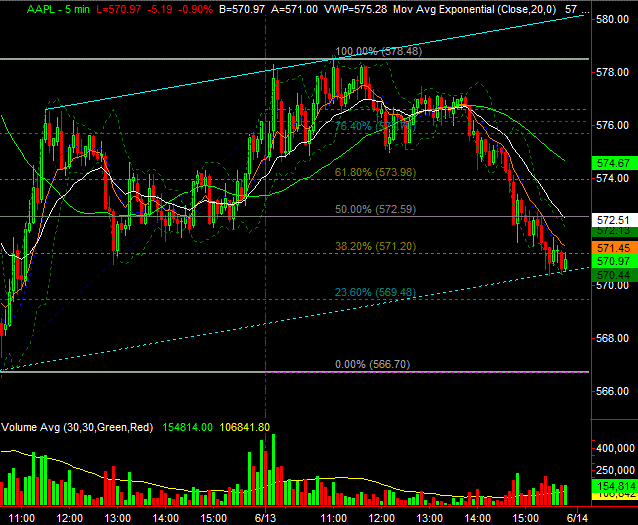
AAPL - At Inflection Point

Very weak price action but the first inflection point for possible bounce is the lower trend line of the ascending channel.


Tuesday, June 12, 2012

YELP - Strong Overhead Resistance

After a 44% move over the last week or so, YELP has a strong resistance area to deal with at the circled area which is a confluence of resistance comprised of:
  1. The light blue horizontal trend line, representing the 1.8 million shares of overhead supply set on May 3 at 20.30.
  2. The dotted red line, representing the upper trend line of the descending channel extrapolated from the solid red lower channel line.
  3. The olive line, representing the 50 day EMA at 20.01.
Support is the cyan horizontal line at 17.80.  Given the strong momentum, I suspect it would break out after a few sessions of consolidation.


Tuesday, June 05, 2012

Market Right At Support On Multiple Time Frames

The SPY daily broke the 200 day SMA yesterday but bounced off off the lower trend line.


On the other hand, the SPY weekly lost the 50 week SMA yesterday but bounced off off the projected lower channel line.


Given we are in an oversold conditions but in a confirmed bear market, anything can happen.  This week is crucial.

Friday, June 01, 2012

AAPL - Hanging By A Thread

Sitting on the bear flag channel and on the 20 day EMA.  Looking treacherous.  No positions.


AEM - Too Bad

AEM up over 8% today, on the verge to breakout of the cup with handle structure.  I posted a long set up mid-May.  It was a nice setup, but too bad it fell victim of a shake-out.   See circled area.  I wonder how many trader (not investors who simply rely on "hope") were able to withstand and not waver.  Too bad for me, AEM snapped back with fury since and I could not bring myself to chase after it.  Such is life.


Wednesday, May 30, 2012

YELP - Some Intraday Accumulation

Large volume without further downside.  Doesn't it sound like accumulation?  Larger picture the down trend still look insurmountable, but here it's looking a bit encouraging at the ALL TIME LOW.


Here are the bigger pictures.  Upside volume are still badly needed to change the landscape.

YELP Daily


YELP 60 Minute

FB - Target Reached


Sticking to My Plan

Per my May 22 post, I am layering in my short positions in 3 stages, with the premise that the market is due for a bear market bounce.  The premise can be wrong, but based on the longer term chart, it is better odds than 50 percent.  Now given the premise, I don't know how high the market would bounce, especially on lighter volume.  That's why I layer in at each pivot point, up to where I will have a full position, just in case the market goes down without looking back.  As of yesterday, 2 of my 3 planned entries to the short side have been executed (see pink arrows), via SPXU, VXX, TZA.

There is a fine line between what I am doing and "averaging down" which is a taboo in trading.  Here I have a plan, and each entry is a partial position (progressively larger in size).  I may be guilty in the sense that I am unsure of where to enter a full position if I were to make just one entry.  I can also be accused of "front running", but that can also be diffused by the fact that I'm entering partial position each time.   I am the first to admit that I am a terrible chaser.  I can't wait until the market snaps back down to enter my shorts.  I am also terrible in applying "pyramiding" as preached by Jesse Livermore.  It's complicated and there are endless trading styles. That's why trading is also an art.


Tuesday, May 29, 2012

PWRD - Earnings

I have been watching PWRD for a while for the whole gap closure, and then the earnings tonight.  These are the two things that kept me from going aggressive with the long setup.  And both of my concerns came true.  Gap was closed last session, and the earnings after the bell caused PWRD tankage as much as 20%.  It's recovered some by now but we'll see how it trades tomorrow during regular trading.


A few remarks:

  1. Honor your concerns for any given trade.
  2. Earnings are crap shoots. Stay out or play light.
  3. All setup can go wrong.
  4. Jinx is alive and well in my trading.  It is painful even with just 200 shares.

FB - Target

Target of $28 makes sense.  It's the rectangle target of the recent consolidation ($28.20).  It's the 123.6% Fib extension ($28.05).  And it's the original IPO pricing before raising it to $38.


Friday, May 25, 2012

AAPL Intraday Volume Analysis - Take 2

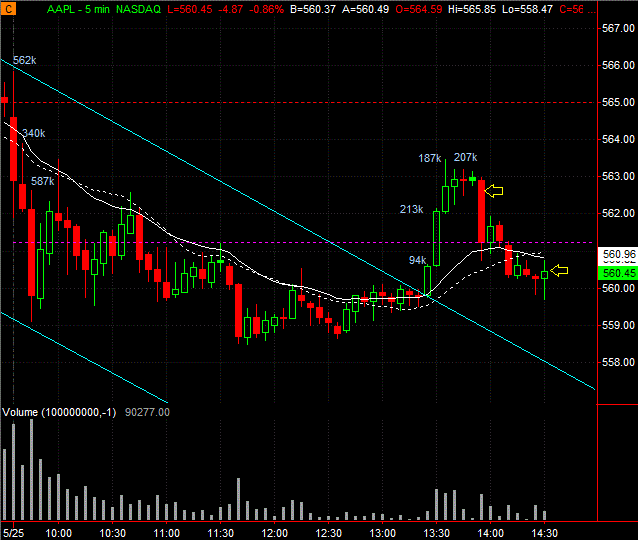
Upon the success of shorting AAPL based on volume and price action yesterday, I tried to repeat again today.


Notice the volume on the first 3 bars of today's 5 minute chart.  They were the biggest volume bars of the day (so far).  Now despite the fact the descending channel was broken with "descent" volume, they were no where close to these 3 bars representing the overhang supply.   As the price began to flag (around the 50% Fib of today's range by the way), I shorted as soon as the low of the previous bar was breached.   I would normally be prepared to go long on such high pole, but today I was armed with the volume "bias" and actually successfully faded the intraday trend.   Now, all setups can go wrong but you'd just have to be prepared for when it does go wrong.  In this case, I successfully got on the right side of the market for my trade.  Nice!

UPDATE:

Exited on the first higher high.  A good $2 trade!


CLOSING UPDATE:

You can see the cyan horizontal line marking the "line of sand" for the overhead supply.  Despite the end of day attempt to rally with increased volume, the effort looked absolutely strenuous and futile!!

One final note: Volume analysis would not work on low priced or low volume stocks!!  That's why stocks such as AAPL, CMG, PCLN, and the like, are better candidates and that's why TraderFlorida trade them, imo.


Wednesday, May 23, 2012

PWRD - Gap Filled

PWRD has had the gap with handle pattern for a long term.  The one thing that made me hesitate was the impending gap fill.  Today it finally happened.  Now the odds may be better with the long position.  However, earnings is due in a day or two (Chinese company so may not observe Memorial Day?).   So it's a bit of a crap shoot as always with earnings.


Tuesday, May 22, 2012

Fading The Market

I am at it again, naughty and fading the market.  Take heed for those who wisely use me as a contrarian indicator!  Unlike the past, I won't be aggressively shorting.  Got an initial position in SPXU.   134 will be the next add.  Final add at the 135.76 major resistance.  Stop loss on break of 50 day MA.

The sell signal is still on.  SPY is currently backtesting the 50 MA on the 60 minute chart. VXX is below 20 again.  Buydonthold.com maintains its sell signal as well.  And I heard the chartist.com went 100% cash yesterday.  Unfortunately, Dr. Fly is going all out with longs upon surviving the carnage without being shaken out.  And TraderFlorida has exited all of his short positions and sitting on 100% cash.

The market is due for a bounce for sure, but the thesis is that this is a bear market bounce and the low will be retested. As such, I will avoid counter trend plays.


Monday, May 21, 2012

BBY - Daily

Bounced off off 76.4 Fib on the daily.


YELP - Buy Target Reached

As outlined in my YELP post earlier this month, YELP's full target was 16.52.  I bot at 16.70 on bounce off the target on good volume.  But strong overhead resistance ahead.   It's now retraced 50% of the drop from a day ago.


Friday, May 18, 2012

Allow The Knife to Stick In The Ground

That's a quote from @FloridaTrader, "allow the knife to stick in the ground."   It's a very graphical and useful advice.  He means to not try to catch a falling knife, as when a stock is in a steep down trend.  For example, WYNN.


Look how many support levels it broke through?  I love many of his (possibly) southern expressions.  "Don't chase the dog unless you own a dog kennel."  LOL, another good one.  It's not right to chase short, and it's not advisable to buy and guess the bottom - unless you're day trading - so best just to sit on the side lines on stocks like this.

It would be interesting to see if the knife is ready to stick in the ground for WYNN...

Thursday, May 17, 2012

WNR - Bullish Case Developing

The pivot (cyan horizontal line) in the 60 minute chart was taken out today with volume.  Now flagging to take out 18.88.


On the daily, the descending trend line was also broken, but now need volume for the rest of the day to validate the breakout.  Ideally a break of 18.88 with volume would confirm the buy signal.