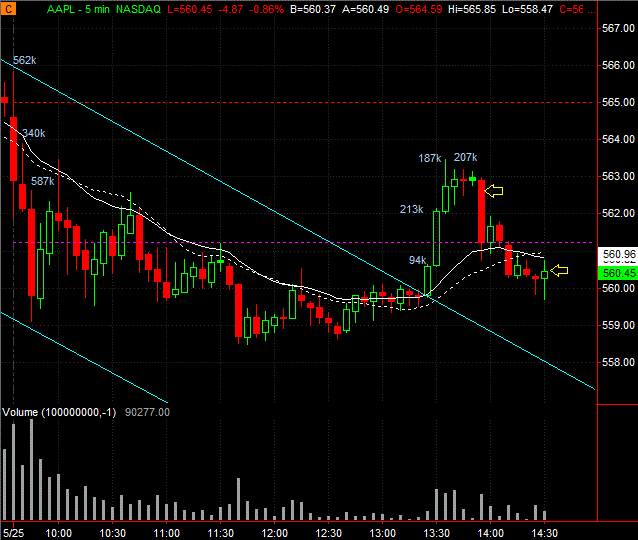
Upon the success of shorting AAPL based on volume and price action yesterday, I tried to repeat again today.
Notice the volume on the first 3 bars of today's 5 minute chart. They were the biggest volume bars of the day (so far). Now despite the fact the descending channel was broken with "descent" volume, they were no where close to these 3 bars representing the overhang supply. As the price began to flag (around the 50% Fib of today's range by the way), I shorted as soon as the low of the previous bar was breached. I would normally be prepared to go long on such high pole, but today I was armed with the volume "bias" and actually successfully faded the intraday trend. Now, all setups can go wrong but you'd just have to be prepared for when it does go wrong. In this case, I successfully got on the right side of the market for my trade. Nice!
UPDATE:
Exited on the first higher high. A good $2 trade!
CLOSING UPDATE:
You can see the cyan horizontal line marking the "line of sand" for the overhead supply. Despite the end of day attempt to rally with increased volume, the effort looked absolutely strenuous and futile!!
One final note: Volume analysis would not work on low priced or low volume stocks!! That's why stocks such as AAPL, CMG, PCLN, and the like, are better candidates and that's why TraderFlorida trade them, imo.


No comments:
Post a Comment