Warning: Following my trades may be hazardous to your financial health. See Disclaimer.
Showing posts with label Wisdom On Trading. Show all posts

Friday, July 27, 2012

Utterly Disgusted With My Luck In Stock Market

Not going to make this into a ranting and whining session, just laying out the facts. Aside from picking Fly's losers and missing out the winners, and not able to participate TraderFlorida's elusive timing on AAPL, my own swing trades haven't been working either.  $BPCOMPQ has been on sell signal for the past 5 days, and for once I told myself I am going to take it religiously, especially with Buydonthold.com also flashing sell signal at the same time.  Even Fly is hedging his longs with VXX.  So I accumulated SDS -- bear ETF on SPY.


Yet, the market loved to fade me.  SPY moved up over 4% today!!


While my long time social networking losers took their post earning plunges in the the past 2 days,  to the tune of (-40%) for ZNGA and for FB, (-12%) on top of the (-8.5%) sympathy drop on ZNGA's disappointment a day earlier.


And for FB, (-12%) on top of the (-8.5%) sympathy drop on ZNGA's disappointment a day earlier.


Missing bandwagons, taking profits too early, holding on to losers, stopped out at low of day, big loser positions, tiny wind fall positions, and market rallying while your position suffer.  One would never be happy in stock market. Even the legendary Jesse Livermore bankrupted a couple of times, got tired of fighting the market, and ended up killing himself.  Enough is enough.

Friday, June 22, 2012

It's All About Volume, or Not

Throughout my trading career, it's no doubt that volume is the most basic yet the most elusive indicator.  Aside from price itself, the only other thing that is always present in any chart is volume.  Yet, I have the hardest time mastering the interpretation of volume in the context of price action.

We've all heard the trading adage, "volume proceeds price."  But which volume bar really matters?  Which volume bars still matter?  What is considered heavy volume?  Relative to what - previous bar, the average volume, or previous big volume bar?  Does volume matter in an intraday chart?  When does a big volume bar indicate exhaustion?  Does volume analyses work on lower priced stocks?


As shown above (from: source), we want to see a trend continuation with increasing volume, thereby confirming the primary trend.  But at some point, as suggested by another rule of thumb, "a surge in volume can often signify the end of a trend"?  So when do we "flip" the volume interpretation?  The following chart was the example used.


One indisputable concept regarding volume is when a break-out of is confirmed by heavy volume.  There is no argument there.  It's bullish, period.


But what if there is no volume confirmation on the break-out?  Price can still rally for a long time with low volume.  So what do we do?  I posted the VZ chart the other day.   There was a massive selling volume at the end of March that defined the epic level of resistance.  But look what happened:  it was taken out like a knife through a carrot cake -- without a fight, on only average volume.  And it has rallied 10% since!   The only take away is this:  just because there is no volume confirmation, it doesn't mean you should fade the price.


Another common application of volume is on double bottoms (or tops).  Assuming the first bottom is accompanied by heavy volume. After a rebound, if the second attempt to make a new low has diminished volume compared to the first, then we could expect a reversal soon.  See the SPY daily chart below.


Everything else about volume is too nebulous, elusive, subjective or whatever word you want to use to describe it.  It's an art.  As such, I find volume as a trading tool quite unusable.  Thank you very much.  It often serves as a noise to confuse me in trading -- that is, until one day perhaps when I finally "get" it!!  If you have any insights, please do post comments!

Tuesday, June 19, 2012

Technical Indicators Can Be "Noisy"

Usually we think of chatters on Yahoo, Twitters, blog sites, and CNBC as noises.  But to me, excessive technical indicators are noises that are even more bothersome.  As I enter a trade and set my stops, I'd realize the stop is just below a moving average -- if it's not on daily chart, I'd see one on the 60 minute chart. As a result, I tend to "stretch" my stop.   Similarly, when a profitable trade has yet to reach my original target, I'd see that it's right at a Fibonacci level;  as a result, I tend to get shaken out at that level prematurely.  Without me knowing, these "noises" actually cause me to take profits too quickly, and hold on to losses too long.  These also could get in the way of order entries.  I wanted to go long on a breakout, but the "volume" is not confirming.  Of course it turned out to be a summer day low volume rally and I'd miss the boat.

Here's a cursory list of the indicators I normally use, multiply them by the various time frames (weekly, daily, 60 minute, and 5 minute):

  • Exponential moving averages (EMA): 10, 20, 50, 200
  • Simple moving averages (SMA): 10, 20, 50, 200
  • MACD
  • STO
  • RSI
  • DMI
  • Horizontal support/resistance
  • Trend lines
  • Channels
  • Fibonacci retracements 
  • Fibonacci extensions
  • TICKs
  • Volume

What can one do with these type of noises?  I don't know.  It's an art.  One can close one eye and pretend these TA indicators do not exist, or unlearn one's knowledge.  But it's a matter of time that these indicators play a key role as inflection points.  For example, one day you feel clueless why that market bounced; then you realize it bounced on the 50 day SMA while the whole time you watch only the 50 day SMA.  

Again, one either gets bogged down with indecision if one includes too many technical indicators, or one can become blindsighted at times by ignoring too many of them.  Take your pick!!!


Market has gone up substantially with the Greek election over the weekend 2 day ago.  Now it's faced with FOMC meeting tomorrow.   The_Real_Fly has claimed victory after recovering 18% within just last 2 weeks!! He's now 15% YTD and raised cash to 40%.  Amazing.  TraderFlorida continues to attack from the short side, but for day trades only.   All signals are still flashing BUY, but SPY is at a major resistance level where my final add would have been 2 weeks ago when signals were still bearish.  STO on both daily and 60 minute charts are overbought above 90.  RSI is overbought on the 60 minutes, but ADX is high-trending at 33.31.  I am bogged down with indecision!!!   Cash is king, but surely I don't feel good missing the rallies from the long side in the past 2 weeks.


Thursday, June 14, 2012

To Follow Or Not To Follow

Over the years I've followed a few services, blogs, and traders via Twitter.  I can tell you eventually I stopped following them one by one, without exception.  The reason I stop following has been that they caused my demise in one way or another.  Then why follow?

Currently I've been following The_Real_Fly and TraderFlorida because they've been impressive.  But as I've posted many times, The_Real_Fly has gone from 20% YTD return down to -5%, and now probably somewhere around 10%.  Have my portfolio got hit in the process?  You bet.

But the real issue is confusion and added stress.  Think about it.  If my trading signal says sell, but The_Real_Fly is 92% long, would I be less aggressive in shorting?  Yes, I would, out of respect and fear.  If then the market goes against me and rallies hard, how would I feel?  Double whammy:  on the one hand, I incur loss on my short positions; on the other, I feel I miss out on the "Fly" bandwagon while he does his best taunting his "enemies".   It's an awful feeling.


Right now TraderFlorida is short and The_Real_Fly is long.  My signal is about to turn from sell to buy.  What should I do?   So far TraderFlorida has a more consistent track record, but I've only followed him since 2 months ago.  And he's only 10% short.  The_Real_Fly has been suffering from giving it all back, but now could be the time he regains his losses.  And he's over 90% long.  Is this complicated or what?!

The best scenario is if my own signal agrees with the people I follow, but it only happens once in a while and I'd be subject to the aforementioned dilemma the rest of the time.

Tune out the noise -- yeah, only if you're confident with your own trading system.  I am still learning and in search of the Holy Grail  in the realm of trading, even though I know it does not exist.

Friday, June 01, 2012

Tune Out the Noises

Once in a blue moon, my plan worked out.  The May bottom got retested on a big red gap.  The late May rally was a bear flag after all.   As my first target has been met, I've taken the profit off the table (SPXU, VXX, TZA).  I'm not going to get greedy, especially with the weekend ahead where Europe may come up with a quick plan to kick the can down the road for a few more months.  You may disagree, but that was my plan.


I would have been a bit more aggressive following my plan if it weren't for TraderFlorida getting bullish in the past few sessions.  He even kept 1/2 of his AAPL position overnight, and actually he said he was going to add more yesterday if AAPL held on to the HOD.   My bearishness was undoubtedly dampened by the red hot TraderFlorida's short term bullishness.  Let's not kid ourselves, if TraderFlorida is long AAPL, who in his right mind would dare to short AAPL?!   So I concocted a pair trade, shorting SPY and long AAPL, overnight. I made out break-even this morning but was more than a bit rattled because the pair trade assumed upside move where AAPL would outperform SPY.  On a downside move, AAPL would move faster than SPY as well.


And how about Mr. Fly, the other twitter personality I respect and  follow?  He was up as much as 20% YTD but as of today he's (-3%).   That's a 23% swing!!!  See his blog today: A Story of Decay and Destruction.   If this kind of roller coaster happens to a professional fund manager, what do you expect as a small time trader/investor?   As he was down so much in the past few session and was still adding more chips to the fire, I couldn't help but adding a few of his longs in sympathy and also just as hedges to my short ETF's, out of respect (and fear of him).  For example, ZNGA, YELP, and TEX.   Well, needless to say, these hedges were just like insurance premiums, spent in vain as the "just in case" scenario did not pan out.


Tune out the noises - not just CNBC but other tweeters and bloggers as well -- IF you have a trading plan which you should, otherwise, you shouldn't be trading.  Not tuning out the noises would confuse you and lessen the conviction for your own trading plan.  Even if he is a respected trader and has a red hot track record, you never see his trading plan as a whole, how much confidence (and thus what position size), how much hedges he has behind the curtain, etc.   Does it sound familiar when a stock tanked and you were pretty much sure that John Doe was screwed, only to find out later that he held some options to hedge his bet and revealed that he made out OK?  Should you risk your hard earned money on only half of a story?


Wednesday, May 30, 2012

Sticking to My Plan

Per my May 22 post, I am layering in my short positions in 3 stages, with the premise that the market is due for a bear market bounce.  The premise can be wrong, but based on the longer term chart, it is better odds than 50 percent.  Now given the premise, I don't know how high the market would bounce, especially on lighter volume.  That's why I layer in at each pivot point, up to where I will have a full position, just in case the market goes down without looking back.  As of yesterday, 2 of my 3 planned entries to the short side have been executed (see pink arrows), via SPXU, VXX, TZA.

There is a fine line between what I am doing and "averaging down" which is a taboo in trading.  Here I have a plan, and each entry is a partial position (progressively larger in size).  I may be guilty in the sense that I am unsure of where to enter a full position if I were to make just one entry.  I can also be accused of "front running", but that can also be diffused by the fact that I'm entering partial position each time.   I am the first to admit that I am a terrible chaser.  I can't wait until the market snaps back down to enter my shorts.  I am also terrible in applying "pyramiding" as preached by Jesse Livermore.  It's complicated and there are endless trading styles. That's why trading is also an art.


Tuesday, May 29, 2012

PWRD - Earnings

I have been watching PWRD for a while for the whole gap closure, and then the earnings tonight.  These are the two things that kept me from going aggressive with the long setup.  And both of my concerns came true.  Gap was closed last session, and the earnings after the bell caused PWRD tankage as much as 20%.  It's recovered some by now but we'll see how it trades tomorrow during regular trading.


A few remarks:

  1. Honor your concerns for any given trade.
  2. Earnings are crap shoots. Stay out or play light.
  3. All setup can go wrong.
  4. Jinx is alive and well in my trading.  It is painful even with just 200 shares.

Friday, May 25, 2012

AAPL Intraday Volume Analysis - Take 2

Upon the success of shorting AAPL based on volume and price action yesterday, I tried to repeat again today.


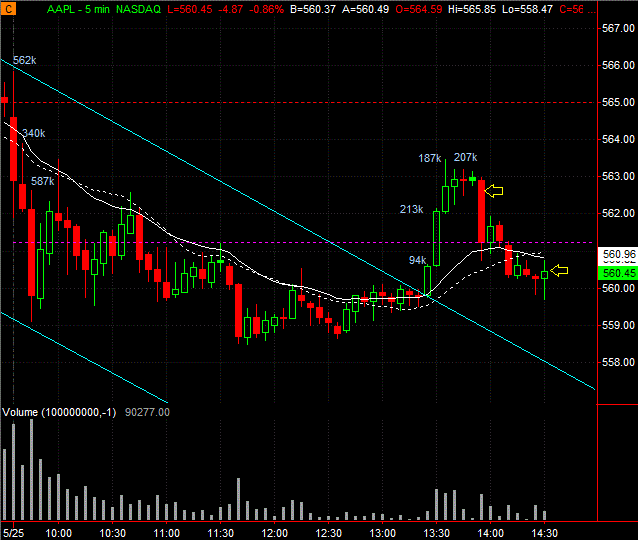
Notice the volume on the first 3 bars of today's 5 minute chart.  They were the biggest volume bars of the day (so far).  Now despite the fact the descending channel was broken with "descent" volume, they were no where close to these 3 bars representing the overhang supply.   As the price began to flag (around the 50% Fib of today's range by the way), I shorted as soon as the low of the previous bar was breached.   I would normally be prepared to go long on such high pole, but today I was armed with the volume "bias" and actually successfully faded the intraday trend.   Now, all setups can go wrong but you'd just have to be prepared for when it does go wrong.  In this case, I successfully got on the right side of the market for my trade.  Nice!

UPDATE:

Exited on the first higher high.  A good $2 trade!


CLOSING UPDATE:

You can see the cyan horizontal line marking the "line of sand" for the overhead supply.  Despite the end of day attempt to rally with increased volume, the effort looked absolutely strenuous and futile!!

One final note: Volume analysis would not work on low priced or low volume stocks!!  That's why stocks such as AAPL, CMG, PCLN, and the like, are better candidates and that's why TraderFlorida trade them, imo.


Thursday, May 24, 2012

AAPL Intraday Volume Analysis

TraderFlorida wasn't around this morning, but this is what he would have said:

Look at the first bar of the day that failed to hold the previous day's high.  This represents 1.06 million shares of overhead supply.  The first attempt to take it out again had only 472k.  Not enough volume.  Then another attempt with 338k - not enough.   And finally 243k.  There is just no volume to take this thing higher.  That's why I reshorted as soon as the breakout failed.   For trade only.   With Greece and all the uncertainties, who would hold longs over the long weekend?   I know I wouldn't.  Market hates uncertainties.


UPDATE:  AAPL is toast.  Get the jelly out!  $6 for the day so far. That's pretty descent for a day trade.  Ah ha, I just love this.  If the low of day is taken out, I will add to my short.  With that being said, have a good one!


Wednesday, May 23, 2012

Be Slow to Take Profit

Be slow to take profit and quick to take loss.  Well, that's one of the trading adages.  Supposedly, if one heeds the adage, even if one is only right 3 out of 10, he can still make a small fortune. We tend to do the opposite: take profits too quickly and sit on losses too long.  Aside from fear and greed at work, for me jinx make it especially hard to execute.  Think about it.  Why did we condition ourselves to do the opposite?  Well, easy, empirical data by way of experience. Once we see the profit turns into loss once too many times, we begin to take profit early.    Now the whole thing is a big topic, so I am just going to focus on a small facet of it.

I am usually very quick at taking profits.  But this time I said to myself, I am going to be patient and ride on my winner -- shorting AAPL at a good entry of just below 560 (see first yellow arrow).   The whole morning I had several opportunity to take profit, but I held my urge.  Every time the green dissipated, it was painful.  But I said to myself, no pain no gain;  this is what one needed to go through to get bigger gain.

Now the horizontal resistance was finally breached.  Guess what?  TraderFlorida, the AAPL guru, actually talked down about the volume, or the lack of it as usual.  So I actually added to my short position when it went up again because I don't see volume confirmation and the price could be just running on fumes.  Then it actually popped out of the rising channel, WITH VOLUME!   I finally bailed, successfully in turning a profit into a loss.


Lessons learned:

  1. Own your own trade.  Listening to others will only confuse yourself.
  2. Never let a winning trade turn into a losing trade, even if it means exit at breakeven and lose the profit.
  3. The adage does not account for how often the draw-down exceeds cost before the target is reached.
  4. Jinx is well and alive. All the pain endured didn't pay off.

Interpreting Volume

I am the first to admit that gauging volume is not my forte and I normally use other indicators derived from volume that are easier to understand.  For for some traders, particularly TraderFlorida, volume is key.

Let's take a look at the ORCL daily. See the 3 attempts of trying to break out of the horizontal resistance as circled below.  Look at the corresponding volume -- low!  No volume to support the break out and the resulting outcome of the failed attempt is devastating.   But this is the easy one.  It's too obvious.


Let's look at the AAPL daily.  I forgot to draw circles but you can see excluding the partial candle (2 hours into trade today), it has had 3 days of rally.  Also look at the corresponding volume for the 3 days.  They are about on par with the 30 day average of 23 million shares.   However, TraderFlorida (who's been the authority on AAPL trades BTW) maintains that the bounce has no volume, or has no volume to support it and therefore he is short.  I simply don't get that argument.  The volume is certainly much larger than (just about) every single day of down trend in the last 2 weeks!

Is the volume "light" relative to the down volume back in April?  Is the volume "light" because it did not dwarf the 30 day volume average?  Or is the volume "light" because a counter-trend move demands much bigger volume for validation?  I am going to read that William O'Neil book over again.  I am just not getting it.   BTW, I am short the market and a bit of AAPL.  It's just that I didn't short because of the volume.


Friday, May 18, 2012

Allow The Knife to Stick In The Ground

That's a quote from @FloridaTrader, "allow the knife to stick in the ground."   It's a very graphical and useful advice.  He means to not try to catch a falling knife, as when a stock is in a steep down trend.  For example, WYNN.


Look how many support levels it broke through?  I love many of his (possibly) southern expressions.  "Don't chase the dog unless you own a dog kennel."  LOL, another good one.  It's not right to chase short, and it's not advisable to buy and guess the bottom - unless you're day trading - so best just to sit on the side lines on stocks like this.

It would be interesting to see if the knife is ready to stick in the ground for WYNN...

Thursday, May 17, 2012

Market Musing & Targets


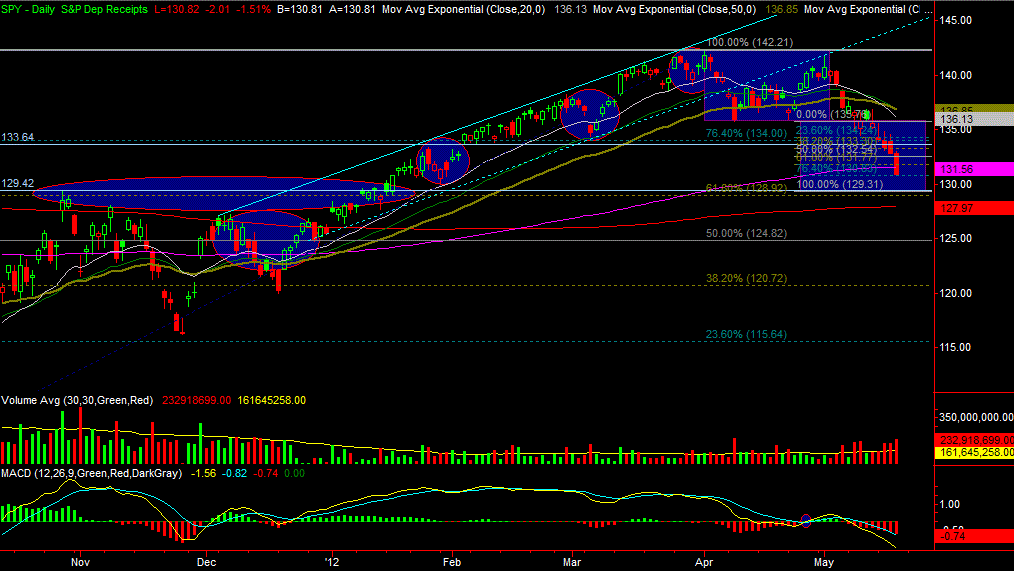
Since the 2011 October bottom, the false leading indicator I subscribed to for the exact 6 deadly month had been advising short-selling the market.  Along the grueling 6 month journey, there were a few double tops which re-kindled the hope that the market was finally heading back down.  See the circled areas.  You can see how already-up-to-my-chin I was near the "top" at the end of February (see Market Has Made Up Its Mind).  In retrospect, the market was only 2/3 done!  But look at the weak volume at the beginning of March -- surely felt like the market top!!!  The market being at its best, finally flash out the final double top a month later (the first rectangle on the chart).  But by then, I've been bruised all over and lost the will to fight the market.  I held only laughable number of shares of bear ETF's (VXX, SPXU, SDS, TZA, SH), and by the time the market retraced 23.60% of the bull run (shown as 76.40 Fib on chart), I've sold out of my last bear shares and actually started accumulating some longs.   Now the market is indeed in the "never look back" mode that I was looking for 2 months earlier and void of any bounces on its way down.

Today's 1.4% selloff reached 76.40% Fib of the rectangle target.  From experience, it should bounce before proceeding to the target of 129.31 area, which happens to coincide with the 129.42 horizontal support. It would make sense to back-test the 200 day EMA (magenta line), especially with tomorrow being the historical FB IPO.

Speaking of the FB IPO, it's only intuitive to think that it would "hype" up the market, based on the past experience: the more IPO's the higher the market goes, and the high the market goes, the more IPO's, etc.  They feed off each other.  However, the shear size of the FB IPO, which will be the largest ever (surpassing V - Visa), introduced a new concept -- that funds would sell other stocks to raise cash in order to jump onto the FB bandwagon.   So the market sold off.   Market just never ceases to amaze me -- and has never been willing to drop its snobbery and accept me as friend.

UPDATE: With all that blood on the Street today, my IRA was down a mere .09%.  Thanks to holdings such as TLT, PEP, HNZ, JNJ, and for today only, CEF, to help offset losses in other issues.

Getting Burned From The PNRA-CMG Pair Trade

My luck ran out on the PNRA-CMG pair trading today.  Not sure why such discrepancy in the price movement between the two today.  PNRA down 4% while CMG only down 2%.  You can guess which one I am short and which one I am long!  May be it has something to do with the options expiration tomorrow?  Just in case it's the case, I am going to hold both positions till next week.  Regardless, the lesson is that nothing is safe from disaster, and you have to be prepared.  Second lesson:  I'm still cursed and my trades are still jinxed!


Monday, May 14, 2012

Is MACD Overrated?

Continuing with my thesis of wild goose chase in search of the non-existent holy grail of trading system, I've concluded MACD is way overrated.  Look at the AAPL intraday 5 minute chart below.


Do we see MACD positive divergence?   Surely we do.  We got lower low in price, yet MACD is higher and crossing over to the upside.  Not shown is the ADX reading of 15.48 -- not strong trending at all.  STO also was just coming out of the oversold area.  Yet, TraderFlorida posted that he's adding to his short on this bounce.   Boy, he's been red hot on AAPL and continued to be.  Let's see how the day panned out.


May be the MACD indicator, much like head & shoulder pattern, are simply overrated and too unreliable that it should be dropped from my charting?!   Surely all indicators are not reliable all the time, but too many indicators can confuse us, causing missed entries and premature exits.

On The Coattails

Over the years, I've subscribed to numerous investment and trading services, and followed forum posters and financial bloggers.  Yet I find myself constantly phasing out the old and ushering in the new.  Why?  Because none of them consistently work to your satisfaction!   Most of them out right caused you to lose more money than you would have otherwise.  Some of them don't fit your trading style -- pumping-and-dumping penny stocks , making too many trades, making too few trades, etc.  Sometimes, you feel betrayed by some posters because they did not post when they bailed, leaving you holding the bag.  Most posters look impressive and make calls like geniuses when the market goes up, but when the market corrects, all of them suck wind.  There are exceptions, but they are hard to find.  I am equally guilty if any readers make trades as a result of reading my posts.

As hot as the_real_fly was in the beginning of this year, every single move he made in the past month has been wrong.  His calls on YELP was particularly disastrous.   I wrote a post earlier this year on "mean reversion" as applied to one's trading success (see here).  At the rate the market is going against his longs, my theory may actually come true, that the_real_fly is going to lose most of his 20% year to date gain soon.  UPDATE: Fast forward 3 days later, he is now up 6% year to date.

TraderFlorida has been hot since I've "monitored" him over the past months.  He's calls on AAPL short has a success rate of 95%.  But should I be leery if I start following his trade that thing would start going wrong for him and the market starts moving the_real_fly's way?  You bet.   The proprietary long term indicator called the market top and the bottom with 100% success rate, but 7 months ago when I finally decided he's got the market edge, Operation Twist started and his leading indicator went upside down.  As a result, I lost big over the grueling 6 month shorting when the market had one of its biggest rallies in history -- all because of the false confidence level based on the leading indicator's past performance.

There is no holy grail on the coattails of others.  You must own your trades, even if you get in because of someone reputable. That means you still have your own target and stop loss in mind.  That's my two cents for the day.

Tuesday, May 08, 2012

Order Entry Errors

It's been months since the time I used to make tons of order entry errors, especially back when I was using Interactive Broker's spreadsheet/hot-key rapid fire combination! With Tradestation, it doesn't happen as much any more.  This morning I was happily doing pair-trading shorting CMG and longing PNRA.  I had 3 winning pair-trades already, and I warned myself that I should call it a day. From experience, for anything, it's best not to push your luck after you got a break 3 times in a row.  I relented, however, since so far the trades seem to be sure-shots.  So I entered yet another pair-trade.  I let the pair fight agains each other as usual.  Suddenly, I noticed that both are in big red.  I was baffled by the unusual sight.  I quickly looked at my position bar.  Darn it.  I had both trades "long"!!!  I am used to the notion of pressing the blue button to "enter" a trade, and the blue button to "exit" a trade.  And I had made the mistake of pressing the blue buttons for both sides of the pair-trade!   Of course, per the universal law of jinx, when I make an order entry error, it has to be against me.  Why didn't both stocks go up, instead of down?!   I quickly closed one leg, and partially close the other since the position were simply too big without hedging.  I eventually close the remaining shares after some small bounce.  When all was said and done, this order entry error had erased my day's gain.  Lessons learned.

  1. Order entry errors have no place in trading
  2. After 3 winning trades, call it a day


Thursday, May 03, 2012

Follow Up on CMG, PNRA Pair Trade

I've traded the CMG/PNRA pair trade 3 times since I posted the other day.  All three trades were profitable.  CMG and PNRA basically moved in tandem along with the broad market; however, the pair trades proved advantageous because:

  1. The hedging greatly reduced my emotional anxiety, thus prevented me from being shaken out of trade easily.
  2. There were (bound to be) market inefficiencies at times, allowing the pair trades to become temporarily profitable.
So essentially, I was able to hold on to the trades until they become profitable; at such time I'd duly exit the trades.  Nothing is guaranteed, but so far it's worked out nicely.

Monday, April 30, 2012

CMG + PNRA Pair Trades

While I like both CMG and PNRA, especially their menus, I can't help but toy with the thoughts of pair trades between them given the uncertainty in the current market.  I am generally not a believer of hedging in terms of using options of the underlying stock -- why not simply reduce the number of shares if one is unsure?  On the other hand, I am open to occasional pair trades as it is hedging involving more than 1 stock.   Take the following setup with a grain of salt, do your own diligence and pull your own trigger as always.

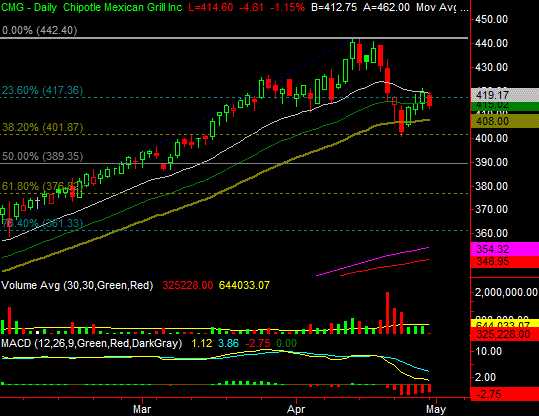
I am pondering on shorting CMG and long PNRA.  Fundamentally CMG's more expensive with P/E of 56.97 vs. PNRA's 32.49.  However, CMG has a stronger balance sheet and has a good potential for a short squeeze with short float of 16.76% (PNRA has just 3.27%).

Chart-wise, it's a bit easier to justify.  PNRA had a recent earnings pop and so is currently on high-pole pattern, bull-flagging.  CMG, on the other hand, had a recent high volume sell-off and is forming a low-volume bear flag.


Tuesday, April 24, 2012

One Pitfall In Technical Analysis

First one must realize that all indicators are not reliable.  So even there lies a pitfall:  Marrying to your indicators.  Don't marry to any indicators, much less a "leading" indicator!  When price action is not doing what the indicator indicates, either bail out of the trade or stick to your stops.  Indicators are good for timing entries and exits - in case they are right!!

But that's not what I planned to write about.  The one subtle pitfall is that when you knows quite a few technical indicators, it is easy for you to selectively tune in to some and shun others depending on your emotional bias.  Take ZNGA as an example, my original set up was to add at 176% Fib extension, but because of an intraday high volume break of an intraday resistance, I front-ran my setup and went long.  Now its below my entry but should I now fall back to my original plan?  

Another example is more common.  Let's say you went long on TZA gap support, and it failed. Instead of taking loss, you saw the 20 MA not far below so you held on.  It failed.  And instead of taking loss, you saw the 50 MA and the 50% Fib just below as confluence of support so you held on.  Sounds familiar?

You see, it doesn't mean it would go against you all the time, but it's just that it would get you into bigger trouble than otherwise.

STO is oversold, but RSI is not.  What do you do? Price is bouncing, but no positive divergence.  What do you do?  Trend line break, but no volume. What do you do?  Price break all supports but there is a strong MACD positive divergence.  You see, you can easily jump the gun on any indicator while it is in fact premature.  Yes, trading may be an art, but that lack of rigid rules is reserved for the masters.  The rest of us have better learn the rope and stick to a set of system and rigid rules and live to trade another day in order to someday master the art of trading.  If you can't blame failures on one system/setup consistently, then you probably have fallen victim of the aforementioned pitfall.