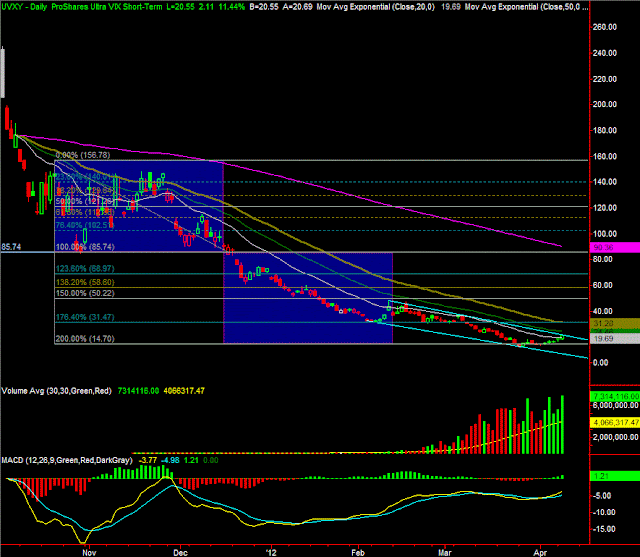
Look at the daily chart and marvel at the mathematical precision of the rectangle target! It's up against the down channel line, but the chart looks very bullish with explosive volume as of late. The obvious resistance is the 23.6 Fib retracement (176.40% on chart) at 31.47 and the 50 day EMA at 31.28. Together they form a confluence of resistance. The support is obvious the all time low of 12.60.
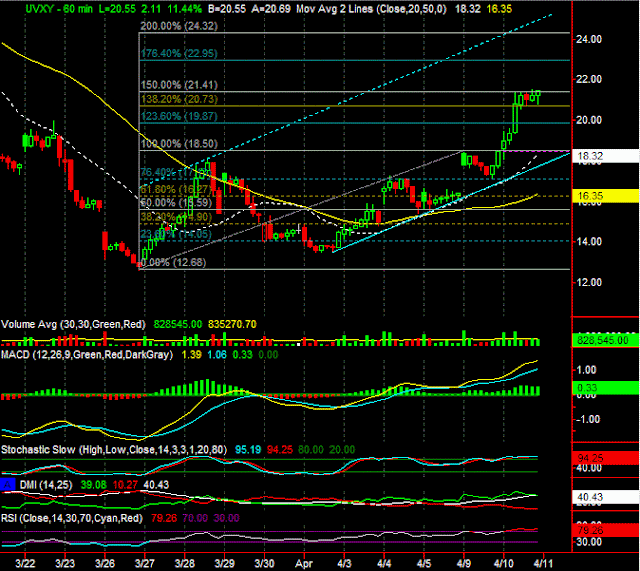
On a shorter term, 22.95 and 24.32 are the next resistance. and 19.87 and 18.50 as the next support, as per the 60 minute chart below.
This is not for the faint of heart. For aggressive traders only!


No comments:
Post a Comment